Running a Poultry Business Requires More Than Daily Reports
A poultry business generates a large amount of information every day.
Bird placements.
Mortality.
Feed consumption.
Body weight.
Egg production.
Hatchability.
Feed production.
Medicine consumption.
Purchase costs.
Sales.
Customer orders.
Inventory.
Payments.
All of these numbers matter.
The problem starts when this information sits in different places.
Farm supervisors maintain one set of records.
The feed mill has another.
The hatchery maintains its own reports.
Finance works with accounting data.
Sales keeps customer information separately.
Management then has to bring everything together before making a decision.
By the time the numbers are collected, the situation on the farm may already have changed.
Management Needs Current Information
A poultry business cannot be managed properly by looking only at last month’s report.
If mortality increases this week, management needs to know now.
If feed consumption is higher than expected, the reason needs to be investigated.
If egg production falls below the expected level, the farm team should not wait until the monthly review.
The same applies to hatchery performance, feed costs, medicine usage and inventory.
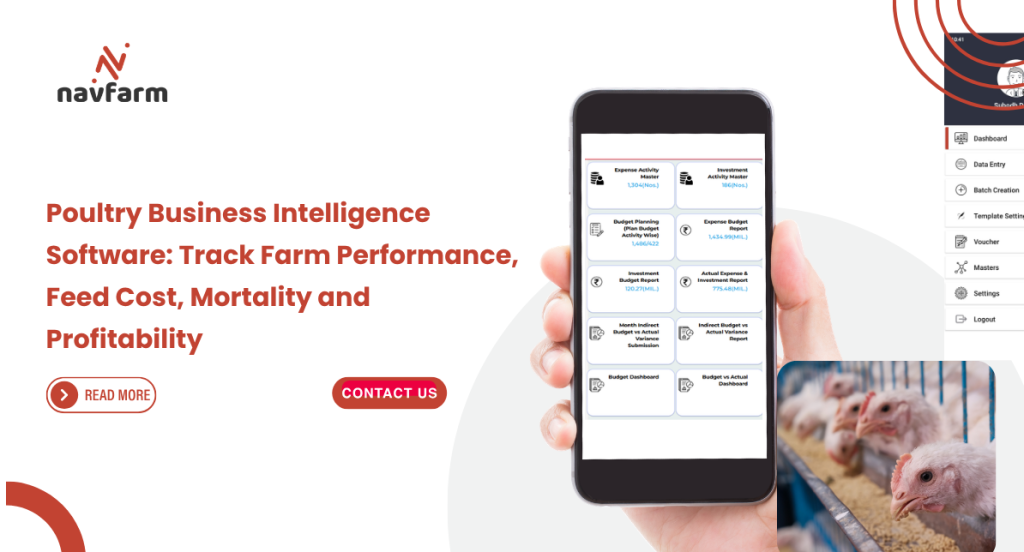
A good dashboard gives management a current view of what is happening across the business.
Dashboard Should Show What Needs Attention
A dashboard should not simply display hundreds of numbers.
Management needs to see the information that requires action.
For example:
Farm A has higher mortality than the target.
Farm B has lower body weight than expected.
Feed consumption is higher than planned.
Egg production has dropped.
A hatchery batch has lower hatchability.
Feed raw material stock is approaching its minimum level.
A customer order is waiting for delivery.
These are the numbers that help management decide where to focus.
Farm Performance Should Be Easy to Compare
When a poultry company operates multiple farms, comparing performance manually becomes difficult.
Management may want to compare:
- Mortality
- FCR
- Average body weight
- Feed consumption
- Growth
- Uniformity
- Farm capacity
- Cost per bird
- Cost per kilogram
A dashboard can show the performance of every farm using the same measures.
This makes it easier to identify farms that are performing well and farms that require attention.
Feed Is One of the Biggest Cost Areas
Feed normally represents a major part of poultry production cost.
That makes feed consumption one of the most important numbers for management.
The dashboard should help answer questions such as:
How much feed was planned?
How much was actually consumed?
Which farm consumed more than expected?
What is the current FCR?
How much feed is available?
How much feed will be required for upcoming batches?
These figures become much more useful when they are connected with production and farm data.
FCR Should Not Be Viewed in Isolation
Feed conversion ratio is an important poultry KPI.
But looking at FCR alone does not explain why performance changed.
A change in FCR may be related to:
- Feed quality
- Bird weight
- Mortality
- Age
- Feed consumption
- Environmental conditions
- Disease
- Management practices
A useful dashboard should allow managers to move from the KPI to the underlying operational information.
For example, if FCR increases on one farm, management should be able to review feed consumption, body weight and mortality for the same batch.
Mortality Trends Need Early Attention
Daily mortality is recorded on every poultry farm.
But looking at individual daily figures does not always show the complete picture.
A trend is more useful.
Management may want to see mortality by:
- Farm
- Shed
- Batch
- Breed
- Age
- Location
- Production cycle
This helps identify unusual patterns.
If one farm consistently performs worse than other farms with similar bird age and breed, the management team has a clear reason to investigate.
Egg Production Needs Its Own View
For layer operations, egg production is one of the most important performance indicators.
Management needs visibility into:
- Total eggs produced
- Production percentage
- Eggs per bird
- Cracked eggs
- Broken eggs
- Saleable eggs
- Egg grade
- Farm wise production
- Batch wise production
Production can also be compared with the expected output.
If actual production falls below the plan, the farm team can investigate the reason instead of waiting for the end of the cycle.
Hatchery Performance Should Be Connected with Production
Hatchery performance affects the rest of the poultry business.
Management may want to compare:
- Eggs set
- Fertility
- Hatchability
- Chicks produced
- Cull chicks
- Hatchery loss
- Batch performance
These numbers become more useful when connected with breeder batches and planned chick requirements.
If the hatchery is expected to produce a certain number of chicks for upcoming placements, management can compare planned demand with expected hatchery output.
Demand Forecasting Can Support Production Planning
Business intelligence becomes more valuable when it is used for planning, not just reporting.
For example, customer orders can be used to estimate future chick requirements.
Expected chick demand can then be compared with hatchery capacity.
Farm availability can be reviewed against the planned placement.
Feed requirements can be estimated from planned batches.
This creates a connection between demand, hatchery production, farm capacity and procurement.
Instead of reacting to demand, the business can prepare in advance.
Farm Capacity Should Be Visible
Farm capacity changes over time.
Some sheds may be occupied.
Some may be under maintenance.
Some may be available for new placement.
A management dashboard should show:
- Total farm capacity
- Occupied capacity
- Available capacity
- Planned placement
- Birds currently housed
- Capacity by farm
- Capacity by shed
This information helps production planners decide where the next batch can be placed.
Cost Information Makes the Dashboard More Useful
Operational KPIs tell management what is happening.
Cost information tells them what it means financially.
A poultry dashboard can connect operational performance with cost data.
For example:
Feed cost per bird.
Medicine cost per bird.
Cost per kilogram.
Cost per egg.
Farm operating cost.
Batch cost.
Production cost.
Sales value.
Gross margin.
This gives management a clearer view of the financial performance of each farm or production batch.
Reports Should Help Management Ask Better Questions
A good dashboard does not replace the management team.
It gives them better information.
If one farm has higher feed consumption, management can ask why.
If mortality increases, the veterinary team can investigate.
If hatchability falls, the hatchery team can review the batch.
If feed costs increase, procurement can review raw material prices.
If margins fall, finance and sales can examine pricing and production costs.
The value of business intelligence comes from connecting these questions with the underlying data.
NAVFarm Business Intelligence
NAVFarm brings operational information from poultry farms, hatcheries, feed operations, inventory, procurement, sales and finance into one connected environment.
Management can view important poultry KPIs through dashboards and reports rather than collecting information manually from different departments.
Farm performance can be reviewed alongside feed consumption, mortality, body weight and production.
Hatchery performance can be compared with chick demand.
Inventory can be reviewed against upcoming production requirements.
Sales information can be compared with production and profitability.
Because NAVFarm works with Microsoft Dynamics 365 Business Central, operational and financial information can be connected instead of being maintained in separate reporting systems.
Purpose of a Poultry Dashboard Is Simple
Management should not have to spend half a day collecting numbers before understanding what is happening in the business.
The right information should already be available.
Farm managers need farm performance.
Production managers need production and feed information.
Veterinary teams need health indicators.
Hatchery managers need hatchability and chick production.
Procurement needs inventory and future requirements.
Finance needs cost and profitability.
Senior management needs the complete picture.
That is what a properly designed poultry business intelligence system should provide.
Farm Dashboard Should Start with the Basics
A farm manager should be able to open the dashboard and understand the current situation without going through multiple reports.
The first screen can show:
- Total birds
- Active batches
- Farm capacity
- Occupied capacity
- Available capacity
- Today’s mortality
- Feed consumed
- Average body weight
- FCR
- Production against plan
These figures give a quick view of what is happening across the farms.
The manager can then move into a particular farm, shed or batch when something requires attention.
Batch Performance Is More Useful Than Only Farm Totals
Farm level numbers can hide problems.
For example, a farm may show an acceptable average FCR, but one particular batch may be performing poorly.
A batch dashboard should allow managers to review:
- Placement quantity
- Current birds
- Mortality
- Mortality percentage
- Feed consumption
- Average body weight
- FCR
- Age
- Expected weight
- Actual weight
- Cost per bird
- Cost per kilogram
Comparing planned and actual performance makes it easier to identify underperforming batches.
Planned Versus Actual Performance
Planning is useful only when actual results are compared with the plan.
Suppose a batch was expected to reach a certain body weight by a particular age.
The dashboard should show the expected result alongside the actual result.
The same approach can be used for:
- Feed consumption
- Mortality
- Body weight
- Egg production
- Hatchability
- Chick production
- Production cost
This gives managers a clear view of where performance is moving away from expectations.
Feed Cost Should Be Visible Alongside Feed Consumption
Knowing that a farm consumed 20 tonnes of feed is useful.
Knowing what that feed cost is even more useful.
Feed reporting should connect consumption with cost.
Management can then review:
- Feed quantity consumed
- Feed cost
- Cost per bird
- Cost per kilogram
- Feed cost by batch
- Feed cost by farm
- Planned feed cost versus actual
This helps identify farms or batches where feed consumption or feed cost is higher than expected.
FCR Trends Can Show Problems Early
FCR should be monitored throughout the production cycle rather than calculated only after the batch is completed.
A dashboard can show FCR by age and compare it with the expected level.
If performance starts moving in the wrong direction, the farm team can investigate while the batch is still running.
This gives management an opportunity to take corrective action before the final production result is affected.
Mortality Alerts Should Be Easy to See
Not every mortality increase requires the same response.
The dashboard can help highlight farms or batches where mortality has moved above the defined limit.
Managers can review mortality by:
- Farm
- Shed
- Batch
- Age
- Breed
- Date
A trend is usually more useful than one day’s number.
If mortality remains higher than expected for several days, the veterinary and farm teams can investigate the situation.
Layer Farms Need a Different Dashboard
Layer operations have different performance requirements from broiler farms.
The dashboard should focus more on egg production and flock performance.
Important indicators include:
- Birds in production
- Eggs produced
- Production percentage
- Eggs per bird
- Saleable eggs
- Broken eggs
- Egg grades
- Feed consumption
- Mortality
- Average egg weight
Farm wise and batch wise comparisons help management understand where production is above or below expectations.
Egg Production Forecast Can Support Sales Planning
Egg production should not be planned only after eggs are available.
Historical production, flock age, current production and planned flock movements can be used to estimate future egg availability.
For example, if several layer batches are approaching peak production, expected egg output can be estimated for the coming weeks.
Sales teams can then use this information while planning customer commitments.
Procurement and packaging teams can also prepare according to expected production.
This creates a direct connection between production planning and commercial planning.
Customer Orders Can Support Demand Planning
Business intelligence can also work in the opposite direction.
Instead of only asking how much the farm will produce, the business can start with expected demand.
Customer orders can be analysed to estimate future requirements.
For example:
Customer orders indicate expected demand for a particular period.
The system calculates the required number of chicks.
Hatchery capacity is reviewed.
Farm capacity and availability are checked.
Feed requirements are estimated.
Production plans are created based on the available capacity.
This gives management a clearer picture of whether the business can meet expected demand.
Hatchery Capacity Should Be Compared with Demand
A hatchery may have sufficient physical capacity but still face a shortage of chicks for a particular period.
The reason could be breeder flock availability, egg supply or hatchery scheduling.
A dashboard can compare:
- Expected chick demand
- Planned chick production
- Hatchery capacity
- Eggs available for setting
- Expected hatchability
- Available chicks
This helps planners identify gaps before they affect farm placement schedules.
Farm Capacity Should Be Part of the Planning Dashboard
Production planning also depends on available farm space.
A business may have demand for additional birds but no available shed capacity.
The dashboard should show:
- Total capacity
- Current occupancy
- Birds planned for placement
- Available capacity
- Farms under maintenance
- Expected capacity after batch depletion
This allows planners to select the right farm for the next placement instead of making decisions based only on current stock.
Inventory Alerts Should Connect with Production
Inventory reporting becomes much more useful when it is connected with future requirements.
Suppose three new batches are planned next month.
The system can estimate the feed, medicine, vaccine and other materials required for those batches.
Current inventory can then be compared with expected requirements.
Management can identify:
- Materials available
- Materials already ordered
- Expected shortage
- Excess inventory
- Items approaching expiry
This helps procurement place orders based on actual requirements instead of estimates.
Management Should See the Financial Impact
Operational performance and financial performance should not be viewed separately.
A farm may have good production numbers but poor profitability because feed or medicine costs are too high.
Another farm may have slightly lower production but better margins.
Management should therefore be able to compare:
- Revenue
- Feed cost
- Medicine cost
- Labour cost
- Farm expenses
- Production cost
- Cost per bird
- Cost per kilogram
- Gross margin
This provides a much more realistic picture of farm performance.
One Dashboard Cannot Serve Everyone
Different users need different information.
A farm manager needs operational KPIs.
A hatchery manager needs hatchery performance.
A feed mill manager needs production and raw material information.
A procurement manager needs stock and purchasing requirements.
A sales manager needs customer orders and available supply.
Finance needs revenue, cost and profitability.
Senior management needs a combined view.
NAVFarm can provide role-based dashboards so each user can focus on the information relevant to their work.
Mobile Access Is Important for Poultry Operations
Poultry operations do not happen behind a desk.
Managers move between farms, hatcheries, feed mills and offices.
Having access to important information through mobile devices makes it easier to review current performance while travelling or working on site.
Farm teams can also enter operational data from the field instead of waiting to return to the office.
This reduces delays between what happens on the farm and what management sees in the system.
Business Intelligence Becomes Valuable When Data Is Connected
A dashboard by itself does not improve poultry performance.
The quality of the information behind it matters.
If farm data, feed data, inventory, hatchery information, sales and finance are maintained separately, management still has to connect the information manually.
When these areas are connected, the dashboard becomes much more useful.
Management can move from a business level number to the farm, batch, transaction or customer behind that number.
That is where business intelligence becomes a practical management tool rather than another reporting screen.
Poultry Business Intelligence Should Help Management Take Action
A dashboard is useful when it helps someone make a decision.
If mortality is increasing, the veterinary and farm teams should know.
If feed consumption is above the expected level, the farm manager should be able to investigate.
If egg production is falling, sales should know that future availability may be affected.
If a raw material is likely to run short, procurement should have enough time to arrange the purchase.
The purpose of poultry business intelligence is not to create more reports. It is to bring the right information to the right person at the right time.
Management Can Compare Farms from One Screen
For businesses operating several farms, comparing performance manually takes time.
A central dashboard can show the performance of all farms together.
Management can compare:
Farm wise mortality
Farm wise FCR
Average body weight
Feed consumption
Production cost
Cost per bird
Cost per kilogram
Farm capacity
Current batch status
This makes it easier to identify farms that are performing well and those that need attention.
Drill Down from Business Level to Batch Level
A total number often does not explain the actual problem.
For example, management may see that the overall mortality rate has increased.
The next question is which farm is responsible.
From there, they may need to identify the batch.
Then the shed.
Then the age of the birds.
A useful poultry dashboard should allow this type of drill down.
Management can start with the overall business and move down to the farm, batch or transaction that is causing the issue.
Alerts Can Reduce the Time Between Problem and Action
Some information needs immediate attention.
A dashboard can highlight situations such as:
Mortality above the defined limit
FCR above the expected level
Body weight below target
Feed consumption higher than planned
Egg production below forecast
Low hatchability
Low feed stock
Medicine approaching expiry
Farm capacity becoming available
Customer demand exceeding planned production
These alerts help teams focus on exceptions rather than checking every number manually.
Production Forecasting Can Improve Business Planning
Historical data is useful when it is used to plan future operations.
Previous batch performance can help estimate future production.
For layer farms, historical egg production can support future egg forecasts.
For hatcheries, historical hatchability can help estimate chick output.
For broiler operations, previous growth and feed performance can support production planning.
Forecasts are not exact promises.
They are planning tools that help management prepare for likely requirements.
Demand and Production Should Be Looked at Together
Production teams generally focus on how much the business can produce.
Sales teams focus on how much customers want.
These two numbers should be reviewed together.
If expected customer demand is higher than planned production, management needs to know early.
The business may need to increase placements, adjust hatchery schedules, arrange additional feed or use available farm capacity differently.
On the other hand, if production is expected to exceed demand, sales and procurement teams can plan accordingly.
This connection helps reduce both shortages and unnecessary production.
Profitability Should Be Linked with Operational Performance
A poultry business can have strong production numbers and still have weak profitability.
High feed cost can reduce margins.
Medicine expenses can increase production cost.
Poor FCR can affect cost per kilogram.
Low egg production can reduce revenue.
Sales price also has a direct impact on margins.
Business intelligence should therefore connect operational performance with financial results.
Management should be able to understand not only how many birds were produced, but also what those birds contributed to the business.
Procurement Can Use Business Intelligence for Better Planning
Procurement teams need visibility into both current inventory and future requirements.
If the production plan shows that several batches are scheduled for placement, procurement can estimate the materials required.
The system can compare those requirements with available inventory and open purchase orders.
This helps procurement identify potential shortages before they affect production.
It also reduces unnecessary purchases when sufficient stock is already available.
Sales Teams Can Use Production Information
Sales teams need to know what the business can actually supply.
For example, expected egg production can help sales teams understand future availability.
Expected chick production can help plan customer orders.
Available finished feed can support delivery commitments.
Connecting sales information with production gives the commercial team a more realistic view of available supply.
This is particularly useful when customer orders change frequently.
Finance Gets a Better View of Poultry Performance
Financial reports show revenue and expenses.
Operational reports show birds, feed and production.
Business intelligence brings the two together.
Finance teams can review:
Revenue by farm
Production cost
Feed cost
Medicine cost
Cost per bird
Cost per kilogram
Egg production cost
Sales value
Gross margin
This helps identify where the business is making money and where costs require attention.
NAVFarm Connects Operational and Financial Information
NAVFarm is designed for poultry businesses that need more than basic farm reporting.
Farm operations, hatchery activities, feed management, inventory, procurement, sales and finance can be connected within the same business environment.
This means management does not need to depend on separate spreadsheets to understand the complete picture.
Farm performance can be reviewed alongside cost.
Production plans can be compared with customer demand.
Feed requirements can be compared with inventory.
Hatchery output can be compared with planned placement.
Sales can be reviewed against available production.
Because NAVFarm works with Microsoft Dynamics 365 Business Central, operational information can be connected with financial transactions and accounting information.
Power BI Can Bring Poultry Data into Management Dashboards
For organisations that use Microsoft Power BI, poultry information can be presented through management dashboards and visual reports.
Management can review trends over time and compare farms, batches, products and locations.
Typical dashboard areas can include:
Farm performance
Feed consumption
FCR
Mortality
Body weight
Egg production
Hatchery performance
Inventory
Procurement
Sales
Cost
Profitability
The exact dashboard structure can be designed according to the information the business actually needs.
Mobile Data Makes Reports More Reliable
The quality of a dashboard depends on the quality of the information entered into the system.
If farm data is entered several days later, management is not looking at the current situation.
Mobile data entry allows authorised users to record information directly from the farm or production location.
This can include:
Bird count
Mortality
Feed consumption
Egg production
Body weight
Medicine usage
Vaccination
Farm observations
The information can then become part of the wider reporting system.
A Single Source of Information Reduces Manual Reporting
One of the biggest problems in growing poultry businesses is the amount of time spent preparing reports.
Teams collect information from Excel files.
Someone combines the data.
Another person checks the figures.
Management asks for changes.
The report is updated again.
This cycle consumes time every week.
When operational information is recorded in one connected system, much of this manual reporting can be reduced.
Teams can spend more time understanding the numbers instead of preparing them.
Frequently Asked Questions
What is Poultry Business Intelligence Software?
Poultry Business Intelligence Software helps poultry companies analyse operational and financial information such as farm performance, feed consumption, mortality, FCR, egg production, hatchery performance, inventory, sales and profitability.
What KPIs should a poultry dashboard include?
Important KPIs depend on the type of poultry business, but common measures include mortality, FCR, body weight, feed consumption, egg production, hatchability, chick production, inventory, production cost and profitability.
Can poultry BI software support demand forecasting?
Yes. Historical sales, customer orders, production information and operational data can be used to support demand forecasting and production planning.
Can egg production be forecast?
Yes. For layer operations, historical production, flock age, current production and planned flock movements can be used to estimate future egg availability.
Can poultry dashboards show farm capacity?
Yes. A dashboard can show total farm capacity, occupied capacity, available space and planned placements, helping production teams make better placement decisions.
Can NAVFarm integrate poultry operations with finance?
Yes. NAVFarm works with Microsoft Dynamics 365 Business Central, allowing poultry operations and financial information to work together within the same business environment.
Make Poultry Data Useful for the People Running the Business
Poultry companies already have the data they need.
The real challenge is bringing that information together and using it properly.
Farm performance, feed consumption, mortality, hatchery production, inventory, customer demand, sales and financial results all tell part of the story.
When these numbers are connected, management gets a much clearer view of the business.
Problems can be identified earlier.
Production can be planned more accurately.
Feed and inventory can be managed according to actual requirements.
Customer commitments can be checked against expected supply.
Costs can be compared with production performance.
NAVFarm brings these areas together for poultry businesses that want better visibility across their operations. With farm management, hatchery, feed, inventory, procurement, sales and finance connected with Microsoft Dynamics 365 Business Central, management can move from manually collecting information to actually using it for day to day decisions.
If your poultry business is still managing farm reports, production data, inventory and financial information across separate Excel files, it may be time to look at a connected poultry management platform.
Explore NAVFarm to see how poultry operations, planning, reporting and finance can work together in one system.
Book a Free Demo